

Butter price goes off the charts
29/05/2017
From China to Mexico: U.S. dairy export flies
05/06/2017New Zealand: dairy exports declined between January and April. Positive trend in milk and cream
In April, New Zealand dairy exports increased in volume and value, but this is not enough to bring exports in positive in January-April 2017, as compared to the same period […]

The first quarter of this year marks a contraction in volume: -4.8%. Anyhow, export’s value boosts (+20.6%).
In a negative phase, whey powder, milk and cream exports, do a good performance: +0.4% for whey powder and 31.7% for milk and cream sector.
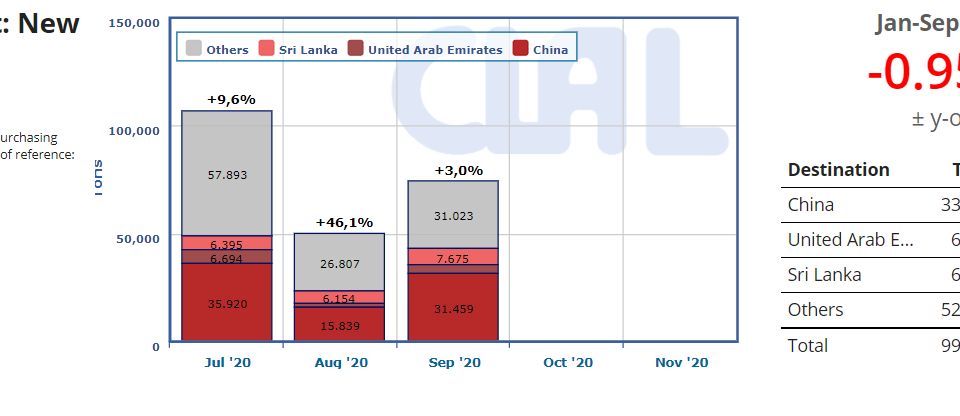
China is one of the leading importers of dairy products from New Zealand. Compared to January-April 2017, Beijing increased imports on a trend basis of cream (+51%), milk (+71%), butter (+23%), cheeses (+27%) and infant formula (+6%).
Referring to revenues, Oceania’s butter price rose by 70% in the January-May 2017 trend, with an increase in May of 96.2%.
The average unit export of cream from New Zealand is also growing uninterruptedly. From January to April it went from 2.55 $/kg to 2.87 $/kg.
Milk deliveries decrease in Australia (-6.9%) and increase in New Zealand (+2.3%).
| NEW ZEALAND: dairy products Export year-to-date (April) | ||||||
| QUANTITY (Tons) | VALUE (‘000 USD) | |||||
| 2016 | 2017 | ± on 2016 | 2016 | 2017 | ± on 2016 | |
| WMP | 468.189 | 445.145 | -4,9% | 1.070.315 | 1.387.976 | +29,7% |
| Butter | 165.563 | 151.753 | -8,3% | 535.495 | 708.677 | +32,3% |
| Cheese | 127.840 | 119.098 | -6,8% | 415.132 | 455.660 | +9,8% |
| SMP | 155.065 | 129.268 | -16,6% | 302.475 | 314.104 | +3,8% |
| Infant milk formula | 19.229 | 17.794 | -7,5% | 166.589 | 172.466 | +3,5% |
| Whey Powder | 37.193 | 37.334 | +0,4% | 152.734 | 168.575 | +10,4% |
| Milk and cream | 69.309 | 91.293 | +31,7% | 86.233 | 125.695 | +45,8% |
| of which: | ||||||
| – Bulk and pack. milk | 48.448 | 63.919 | +31,9% | 35.346 | 51.114 | +44,6% |
| – Cream | 20.861 | 27.374 | +31,2% | 50.886 | 74.581 | +46,6% |
| Casein | 23.368 | 18.782 | -19,6% | 133.920 | 122.355 | -8,6% |
| Caseinates | 10.539 | 10.142 | -3,8% | 75.402 | 80.941 | +7,3% |
| Yogurt and buttermilk | 14.659 | 16.887 | +15,2% | 30.082 | 44.826 | +49,0% |
| Lactose Pharmaceutical | 6.914 | 8.074 | +16,8% | 11.183 | 12.675 | +13,3% |
| Condensed Milk | 49 | 6 | -87,3% | 51 | 29 | -42,4% |
| TOTAL EXPORT | 1.097.916 | 1.045.576 | -4,8% | 2.979.612 | 3.593.979 | +20,6% |
| Data processed by Clal based on GTIS source. | ||||||
|
New Zealand: CREAM EXPORT Main IMPORTERS of 2017 Period: January-April |
|||||
| Ton | Share 2017 |
2015 | 2016 | 2017 | % on 2016 |
| TOTAL | 14.347 | 20.861 | 27.374 | +31% | |
| China | 65% | 6.434 | 11.762 | 17.748 | +51% |
| Malaysia | 4% | 853 | 1.146 | 1.142 | -0% |
| Australia | 4% | 695 | 914 | 1.051 | +15% |
| Taiwan | 4% | 884 | 847 | 1.038 | +23% |
| Indonesia | 4% | 815 | 904 | 962 | +6% |
|
New Zealand: BULK AND PACK. MILK EXPORT Main IMPORTERS of 2017 Period: January-April |
|||||
| Ton | Share 2017 |
2015 | 2016 | 2017 | % on 2016 |
| TOTAL | 32.319 | 48.448 | 63.919 | +32% | |
| China | 67% | 13.115 | 24.878 | 42.580 | +71% |
| Philippines | 14% | 7.963 | 10.549 | 8.873 | -16% |
| Taiwan | 4% | 1.280 | 1.957 | 2.250 | +15% |
| Vietnam | 2% | 684 | 1.159 | 1.316 | +14% |
| Singapore | 2% | 1.397 | 1.411 | 1.063 | -25% |
Do you need additional information on dairy Import/Export? Subscribe to the Dairy World Trade area on CLAL.it

CLAL.it – New Zealand: Monthly export of cream (quantity and average unite price of export)

